total = sum(i ** 2 for i in range(1, 6))
print(f"Sum of squares from 1 to 5: {total}")
Sum of squares from 1 to 5: 55
This is a small test post to confirm the notebook -> Quarto -> Jekyll blogging pipeline works end to end, including code cells, their output, and the Colab button above.
total = sum(i ** 2 for i in range(1, 6))
print(f"Sum of squares from 1 to 5: {total}")Sum of squares from 1 to 5: 55import matplotlib.pyplot as plt
x = list(range(10))
y = [v ** 2 for v in x]
plt.plot(x, y, marker="o")
plt.title("A simple test plot")
plt.show()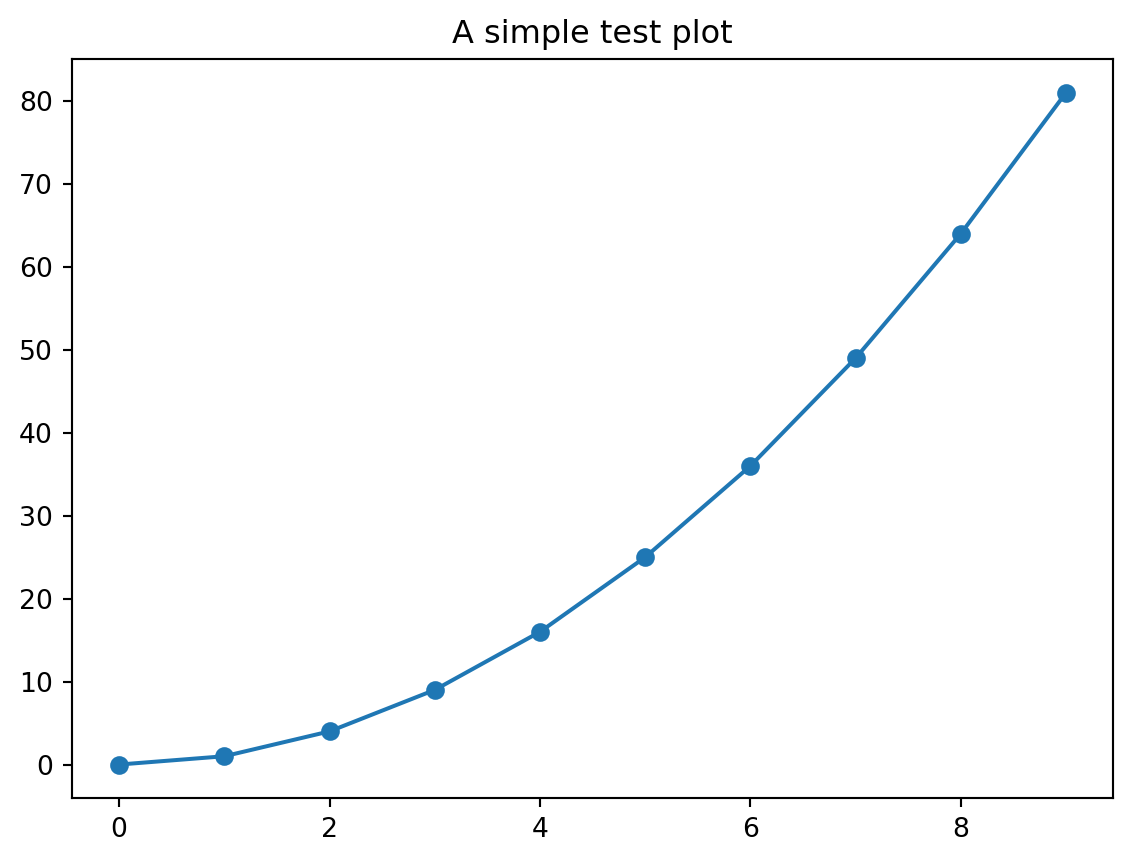
That confirms text, code, and plot output all render correctly together.